CDE will be closed Wednesday, Nov. 27 through Friday, Nov. 29 for the Thanksgiving holiday.
You are here
District and School Performance Frameworks
Overview
Each year, Colorado schools and districts receive performance ratings to let them and their communities know how well they are doing. These reports are called the District Performance Frameworks (DPFs) and School Performance Frameworks (SPFs). The overall ratings assigned are based on achievement and growth on state assessments, along with such postsecondary measures as graduation rates, drop-out rates, college entrance exams and college matriculation rates. The ratings help the Colorado Department of Education (CDE) and State Board of Education (SBE) make decisions about how to help struggling schools.
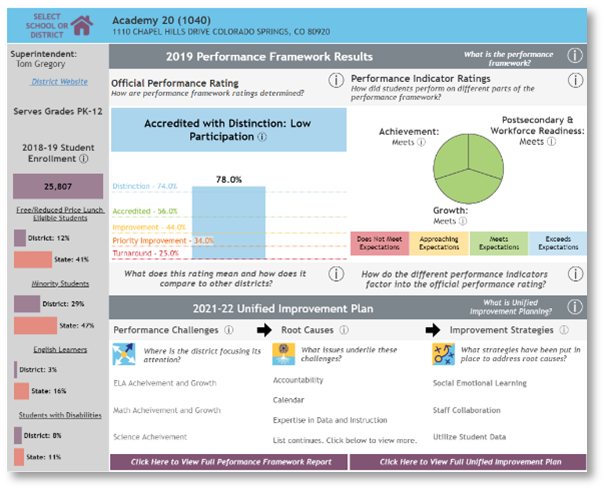
View your school or district's Performance Snapshot!
This report presents a high-level summary of the performance and improvement efforts for each individual school and district across the state. Alongside a summary of student demographic information, this report combines key elements of the District or School Performance Framework results and Unified Improvement Plans and makes both easier to access. The additional contextual information in this report is designed to enable a deeper understanding of performance and greater engagement in improvement planning efforts. Be sure to check out all the information icons and share with friends! Other data tools are available here.
How is performance measured?
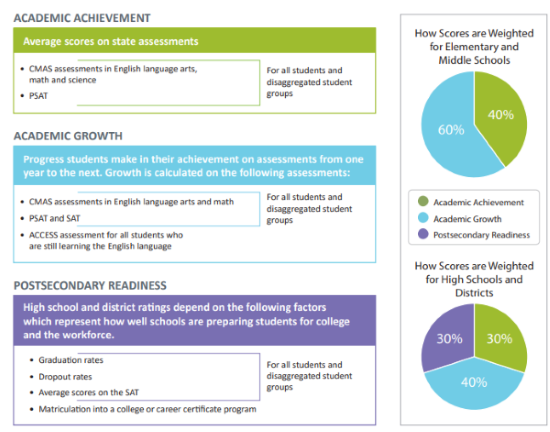
CDE assesses performance based on three key performance indicators.
How are the frameworks calculated?
Schools and districts earn points based on various sub-indicator metrics within each of the above three performance indicators. On each of these metrics, schools and districts earn one of the following ratings and earn points accordingly:
Points are aggregated at the performance indicator level. After applying the performance indicator weightings, shown in the pie charts above, overall school and district ratings are assigned based on the total percentage of points earned.
What overall ratings are assigned?
Schools are assigned one of four plan types and districts are assigned one of five accreditation ratings. Insufficient state data is assigned if there is not enough outcome data to assign a rating.
What do these ratings mean?
School Ratings
Performance Plan - Schools with a Performance Plan are meeting expectations on the majority of performance metrics.
Improvement Plan - These schools are identified as lower performing. They may be meeting expectations on some performance metrics, but they are not meeting or are only approaching expectations on many.
Priority Improvement Plan - These schools are identified as low performing. They are not meeting or are only approaching expectations on most performance metrics. The state will provide support and oversight to these schools until they improve.
Turnaround Plan - These schools are identified as among the lowest performing schools in the state. They are not meeting or are only approaching expectations on most performance metrics. The state will provide support and oversight to these schools until they improve.
District Accreditation Ratings
Accredited with Distinction - This is assigned to the highest performing districts. These districts are meeting or exceeding expectations on the majority of performance tasks.
Accredited - Districts with an overall rating of Accredited are meeting expectations on the majority of performance metrics.
Accredited with Improvement Plan - These districts are identified as lower performing. They may be meeting expectations on some performance metrics, but they are not meeting or are only approaching expectations on many.
Accredited with Priority Improvement Plan - These districts are identified as low performing. They are not meeting or are only approaching expectations on most performance metrics. The state will provide support and oversight to these districts until they improve.
Accredited with Turnaround Plan - These districts are identified as among the lowest performing districts in the state. They are not meeting or are only approaching expectations on most performance metrics. The state will provide support and oversight to these districts until they improve.
How many schools and districts earn each of these ratings?
The general distribution of schools and districts is pictured below and remains fairly consistent each year, in accordance with the framework calculation methodology.
When are the frameworks released?
Preliminary SPFs and DPFs are released annually in September. Following the optional Request to Reconsider process and subsequent approval by the State Board of Education, final reports are released in December.
Resources
Helpful Links
- For additional reports on performance data, view our State Accountability Data Tools and Reports page.
- For information on AEC framework reports, view our Alternate Education Campus Accountability page.
- For information about the implications of consistently low performance on the district and school framework reports and new Performance Watch information, view our Accountability Clock page.
Contact Us
For more information, please contact [email protected].


Connect With Us


